Clik here to view.
Exception in thread Thread-2
@Tomsik wrote: Hello, I get issue when I want to run example dash script. I’ve installed Python, created venv, install Dash package and create python example script. It gets some problems with...
View ArticleClik here to view.
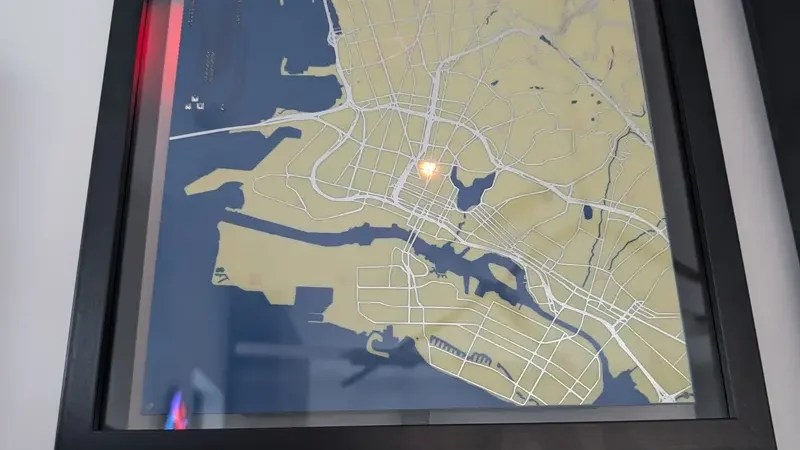
North Side Indicator, Compass, Lat/Lon Indicator for scattermapbox plots
@jhassanandani wrote: I need to put the North Side indicator also known as compass on my maps. I want to use this on scattermapbox where i am plotting lat/lon data points. something like what is shown...
View ArticleDash() got an unexpected keyword argument 'request_pathname_prefix'
@michaelfboxer wrote: I have no idea how i got into this situation. This should be a valid keyword argument, anyidea what i should do? File...
View ArticleAvoid callback method to fire one time for each input
@johan80 wrote: Hi, Imagine a dash web page with three numeric inputs with id=‘x’, ‘y’, and ‘z’. When the user changes the numeric value in any of them, a div with id=‘result’ should be updated with...
View ArticleCreate a drag slider for a graph
@pihk94 wrote: Hey, I am trying to reproduce a drag slider like this one for the intervention day in this link :...
View ArticleExtracting trace properties
@BRM wrote: When I click on a point in one of my chart the following data is generated: {‘points’: [{‘curveNumber’: 1, ‘pointNumber’: 2, ‘pointIndex’: 2, ‘x’: 2009, ‘y’: 13.8947}]} So what I need to...
View ArticleNetwork Graphs using Dash FrameWork
@teja_m19 wrote: I’m unable to display edges and I want the Grid Lines to be removed . And the files are provided in the link . Thank You...
View ArticleClik here to view.
Legend cut off when downloading png
@dig wrote: I’m finding that if I download a png image of a plot on my dash app it cuts off the legend if its a bit longer than normal (see image). It renders fine on the app but when I click the...
View ArticleDisplaying customized geojson with both 'Polygon' and 'Point' features using...
@florescorreia wrote: Hi, I’m using plotly.express to display a customized (built from scratch) geojson file with several ‘Polygon’ features. The customized geojson has the usual structure for the...
View ArticleAdding a background image to a slider Dash
@evileyelive wrote: Hi dear community people, I am a rookie on plotly/dash. For my work, I wish to add a background image, and use coding to describe some special features and points of the...
View ArticleClik here to view.
How to display data on click on a graph?
@MikeP wrote: I have displayed a TreeMap. I would like to display the information of the things I click. So I tried to reproduce the first example given in Dash Tutorial part 4. However it doesn’t...
View ArticleDropdown dcc.Graph()
@degroots wrote: Hey Guys, I am trying to update map based on value selected in dropdown (similar to https://community.plotly.com/t/solved-update-graph-with-value-of-dropdown/6496 But also have a...
View ArticleChange size of NeedlePlot (dashbio)
@Francesco wrote: Hi! I am trying to embed two needle plots side-by-side into a modal pop-up window (from dash_bootstrap_components). The graphs are too large and they overlap each other. Is there a...
View ArticleDash DataTable Clear Active Cell
@noob_programmer wrote: Is there a way to clear the active cell in the DataTables? For example, in all of the examples on https://dash.plotly.com/datatable, when you click on a cell it gets...
View ArticleTrigger change event after changing input value using javascript
@pjh wrote: I’m trying to update an input with javascript, and something seems to be blocking the action or otherwise not allowing me to do what I’m intending to do. This site is not my own, but an...
View ArticleCOVID-19 US counties
@Aadi wrote: https://covid-19-us-states.herokuapp.com/ put together a quick app to track the infection and death counts in my county. hope its useful for others. Posts: 2 Participants: 2 Read full topic
View ArticleHow to add a background image to a dashboard - plotly
@evileyelive wrote: I wish to add a background image to my dash, and I also want to add a figure (go.Scatter) to describe the features or observations of the image, so to make the two layers...
View ArticleDash "Loading..." failure in Apache CGI
@dr_glenn wrote: Another topic (Deploy Dash on apache server [solved!]) talks about the problem I am encountering, but ultimately does not give me enough information, so I’m starting a new topic. I am...
View ArticleClik here to view.
Twitframe (iFrame element) - height adjustable
@kabure wrote: I’m trying to render twitframe in a iFrame element and I want to use a fixed-width value and an auto-height (variable) based in each different tweet. I created a question at...
View ArticleNew Covid-19 Dash App
@chk2817 wrote: Hi Everyone, I thought I would share with the Dash community and maybe get some additional advice. Pretty much a newbie to Dash, Plotly, Git & Co but I have just managed to put...
View Article