@poskaz wrote:
Hello, I would like to know if it is possible to create a grid or table with small charts with Dash. For example:
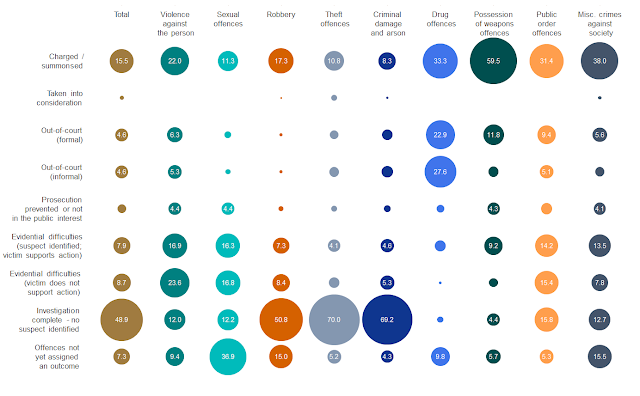
https://i.stack.imgur.com/OIzDZ.png (only the left section with bar-charts)or
![]()
I would like to create something that looks like a table that has fixed categories in the rows and the columns will change depending on input. I don’t think DataTables allow for this implementation. Is that correct? What other option could I use?
Posts: 1
Participants: 1


