@Mahmoud_Housam wrote:
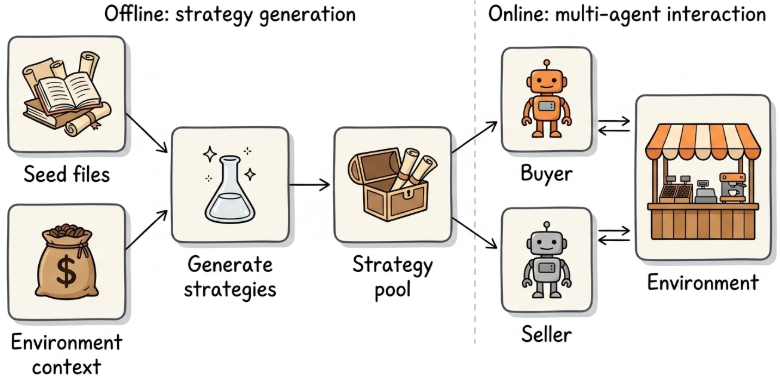
Execuse me, I created my first chart with these dropdowns. Now, I’d like to add another chart in the same page with the same dropdowns. here is the code I wrote
import dash
import dash_html_components as html
import dash_core_components as dcc
import plotly.graph_objs as go
import pandas as pd
from dash.dependencies import Input, Output

df = pd.read_csv('redcap.csv')

app = dash.Dash()

app.config['suppress_callback_exceptions'] = True

year_options = []
for year in df['year'].unique():
    year_options.append({'label': str(year), 'value': year})

unit_options = []
for unit in df['unit'].unique():
    unit_options.append({'label': str(unit), 'value': unit})


app.layout = html.Div([
    html.Div([
        dcc.Dropdown(id='year_picker', options=year_options,
                     value=df['year'].min())
    ],
        style={'width': '48%', 'display': 'inline-block'}),
    html.Div([
        dcc.Dropdown(id='unit_picker', options=unit_options,
                     value=df['unit'])
    ],
        style={'width': '48%', 'float': 'right', 'display': 'inline-block'}),
    dcc.Graph(id='nursing titles')
], style={'padding': 10})


@app.callback(Output('nursing titles', 'figure'),
              [Input('year_picker', 'value'),
               Input('unit_picker', 'value')])
def titles(year, unit):
    dff = df[(df['year'] == year) & (df['unit'] == unit)]
    count = dff['title'].value_counts().reset_index()
    labels = count['index'].astype(str).tolist()
    values = count['title'].tolist()
    data = go.Pie(labels=labels,
                  values=values,
                  textinfo='value+percent',
                  textposition='inside',
                  direction='clockwise',
                  sort=False)
    layout = go.Layout(title='Post Distribution {}'.format(year))
    fig = go.Figure(data=data, layout=layout)
    return fig


app.layout = html.Div([
    dcc.Graph(id='nursing gender')
], style={'padding': 10})


@app.callback(Output('nursing gender', 'figure'),
              [Input('year_picker', 'value'),
               Input('unit_picker', 'value')])
def gender(year, unit):
    dfff = df[(df['year'] == year) & (df['unit'] == unit)]
    count = dfff['gender'].value_counts().reset_index()
    labels = count['index'].astype(str).tolist()
    values = count['gender'].tolist()
    data = go.Pie(labels=labels,
                  values=values,
                  textinfo='value+percent',
                  textposition='inside',
                  direction='clockwise',
                  sort=False)
    layout = go.Layout(title='Gender Distribution {}'.format(year))
    fig = go.Figure(data=data, layout=layout)
    return fig


if __name__ == '__main__':
    app.run_server()
and here is a screenshot that may help imagine

Posts: 3
Participants: 2


![FLO – Therapy at the Club – Pre-Single [iTunes Plus M4A]](http://is1-ssl.mzstatic.com/image/thumb/Music221/v4/a4/11/88/a41188ed-0f2e-e8d5-1163-d59e373cc58c/26UMGIM30046.rgb.jpg/208x208bb.webp)